
Companies have many perspectives to cover to generate real value through their products/services to the customer and market.
Most perspectives are related to Economic indicators, Market indicators, Growth indicators, Business opportunity indicators, Customer retention indicators, Selling indicators (Cross-selling and Up-selling); Competitor’s indicators, Innovation indicators, Talent and skills indicators, Capability indicators, New market indicators, Business trust-player indicators, Work collaboration indicators, Digital capacity indicators, Valuation (Market Cap), see table 01.
The link between company strategy operations, innovation projects, and market opportunity is vital to the business, adding a customer feedback loop. Without measuring its relations, the company doesn’t put the business under proof of continuity value.
| Category | Indicator 1 | Indicator 2 | Indicator 3 |
| Economic | Revenue | Profitability | Financial Performance |
| Market | Market share | Customer satisfaction | Brand awareness |
| Growth | Revenue growth | Profit margin | Return on investment (ROI) |
| Business opportunity | Number of leads generated | Conversion rate | Customer lifetime value (CLV) |
| Customer retention | Customer retention rate | Churn rate | Net promoter score (NPS) |
| Selling | Average order value (AOV) | Cross-sell ratio | Up-sell ratio |
| Competitor’s | Competitive advantage | Market positioning | Share of voice |
| Innovation | Number of new products or services launched | Research and development (R&D) expenditure | Innovation index |
| Talent and skills | Employee engagement | Turnover rate | Training hours per employee |
| Capability | Operational efficiency | Quality standards | Process maturity |
| New market | Market penetration | Market development | Diversification |
| Business trustee-player | Corporate social responsibility (CSR) rating | Reputation score | Stakeholder satisfaction |
| Work collaboration | Team performance | Communication effectiveness | Collaboration tools usage |
| Digital capacity | Digital transformation maturity | Digital adoption rate | Digital readiness score |
These indicator categories should somehow be tracked by all organizational initiatives.
However, the financial perspective is the most important for many kinds of businesses and should be the starting point for other indicators to breakdowns references. Because the measurements for value have relativity correlations and dependencies, it is necessary to create a starting point reference analysis to make tangibles and other perspectives interpretations around it.
The economic perspective is the most common breakdown reference start point because the company proposal is related to market growth, profitability, and the continuity of the product/service usefulness,
Some correlations and dependencies are pointed out in the sections below.
ECONOMIC PERSPECTIVE
Key economic indicators related to product development, financial performance, and market dynamics:
- Time-to-Market (TTM): This metric measures the time it takes to develop and launch a new product or service. A shorter TTM can lead to competitive advantages by allowing companies to respond faster to market demands.
- Profitability Metrics:
- Gross Profit Margin: Calculated as (Revenue – Cost of Goods Sold) / Revenue, it indicates how efficiently a company produces goods or services.
- Net Profit Margin: This represents the percentage of profit after all expenses, including taxes and interest.
- Return on Investment (ROI): Measures the return generated from an investment relative to its cost.
- Revenue Metrics:
- Total Revenue: The overall income generated from sales, services, or other business activities.
- Revenue Growth Rate: Compares revenue over different periods (monthly, quarterly, annually) to assess growth trends.
- Market Size and Demand-Offer:
- Market Size: The total value of a specific market segment or industry. It helps companies understand the potential customer base.
- Demand: The quantity of a product or service that consumers are willing to buy at a given price.
- Supply: The quantity of a product or service available in the market.
- Waste Expenses:
- Cost of Quality (CoQ): Includes expenses related to defects, rework, scrap, and warranty claims. Reducing CoQ improves profitability.
- Inventory Holding Costs: Expenses associated with storing excess inventory, including warehousing, insurance, and obsolescence costs.
- Financial Performance Metrics:
- Earnings Before Interest and Taxes (EBIT): Measures operating profitability before considering interest and tax expenses.
- Working Capital Ratio: Compares current assets (e.g., inventory, accounts receivable) to current liabilities (e.g., accounts payable, short-term debt).
- Debt-to-Equity Ratio: Evaluates a company’s financial leverage by comparing debt to equity.
These metrics provide insights into different aspects of a business, and their relevance depends on the specific context and industry. Companies should choose indicators aligned with their strategic goals and continuously monitor them to drive informed decision-making.
However, company’s teamwork skills affect economics. Talents are highly demanded in order to have a good market performance.
ECONOMICS DEPENDS ON TALENT INDICATORS
Linking economic indicators with talent management is crucial for business success. Good companies have great management teams to do the best monetary allocation.
How to measure it:
- Talent Acquisition and Time-to-Market (TTM):
- Recruitment Efficiency: Measure the time and cost it takes to hire new talent. Efficient recruitment processes contribute to faster TTM.
- Onboarding Time: How quickly new hires become productive. Shorter onboarding times accelerate TTM.
- Talent Retention and Profitability:
- Employee Turnover Rate: High turnover can impact profitability due to recruitment costs, lost productivity, and knowledge gaps.
- Employee Satisfaction (ESAT): Satisfied employees are more likely to stay, leading to better profitability.
- Talent Development and Revenue Growth:
- Training Investment: Investing in employee training enhances skills, which positively impacts revenue growth.
- Sales Training Effectiveness: Well-trained sales teams drive revenue by closing deals efficiently.
- Talent Alignment with Market Size and Demand-Offer:
- Market Research Skills: Talented individuals can analyze market data to identify demand trends and align product offerings.
- Sales Forecast Accuracy: Accurate forecasts help optimize production and inventory levels.
- Talent Efficiency and Waste Expenses:
- Lean Practices: Skilled employees can implement lean principles, reducing waste and operational costs.
- Quality Control Skills: Effective quality control minimizes defects and waste.
- Financially Savvy Talents and Financial Performance Metrics:
- Financial Literacy: Employees who understand financial metrics can contribute to better financial decisions.
- Cost Management Skills: Controlling expenses positively impacts financial performance.
The talent management is a continuous process. Companies should invest in developing their workforce, aligning skills with business goals, and monitoring relevant economic indicators. By integrating talent and economics, organizations can achieve sustainable growth and competitive advantage.
TALENTS WORK GROUPED BY TEAMS
Linking talents with team structure to promote engaging work proposals is essential for effective collaboration and initiative/project success. Here are some strategies to achieve this synergy:
- Cross-Functional Teams:
- Form teams with diverse skills and expertise. Include talents from different backgrounds (e.g., marketing, engineering, design).
- Cross-functional teams enhance creativity, problem-solving, and innovation by combining varied perspectives.
- Proposal Development:
- Team-Based Proposals: Involve multiple talents in creating proposals. Each team member contributes their unique insights.
- Collaborative Brainstorming: Conduct brainstorming sessions where talents collectively generate ideas for proposals.
- Roles and Responsibilities:
- Clearly define roles within teams. Assign responsibilities based on individual strengths.
- Talents should understand their contributions to the proposal process.
- Effective Communication:
- Regular team meetings facilitate communication. Discuss progress, challenges, and adjustments.
- Use collaboration tools (e.g., project management software, shared documents) to keep everyone informed.
- Proposal Evaluation:
- Evaluate proposals collectively. Talents can assess feasibility, alignment with business goals, and potential impact.
- Encourage constructive feedback and revisions.
- Leadership and Talent Development:
- Develop leadership skills within teams. Talents can take turns leading proposal efforts.
- Invest in talent development programs to enhance proposal writing, negotiation, and presentation skills.
Successful proposals result from a combination of individual talents working together effectively. Foster a collaborative environment, celebrate achievements, and continuously improve the proposal process.
The management team needs effective governance; if not, the value-delivery capacity is at risk. Organizational design and team topology are crucial in creating a work environment with guidance. The purpose of the financial allocation is to have a target delivery.
TEAMS NEEDS A DELIVERY APPROACH
Adapting a delivery approach to a business context involves aligning project management practices with value-driven performance. Company initiatives achieve this by implementing and mixing:
- Agile Methodology:
- Scrum: Implement Scrum principles, including sprints, daily stand-ups, and retrospectives. Teams work in short cycles, delivering incremental value.
- Kanban: Visualize work on a board, limit work in progress, and focus on continuous flow. Prioritize tasks based on value.
- Value Stream Mapping:
- Identify the end-to-end process for delivering value. Map out steps, bottlenecks, and delays.
- Optimize the value stream by eliminating non-value-added activities.
- User Story Mapping:
- Create user story maps to visualize features from the user’s perspective. Prioritize based on value.
- Align development efforts with user needs and business goals.
- Lean Principles:
- Just-In-Time (JIT): Deliver features when needed, avoiding overproduction.
- Continuous Improvement: Regularly assess processes and adjust for maximum value.
- ROI-Driven Prioritization:
- Evaluate features based on their potential return on investment (ROI).
- Prioritize high-impact, high-value items.
- Value-Based Metrics:
- Earned Value Management (EVM): Measure progress against planned value. Compare actual work completed to planned work.
- Value Delivered per Iteration: Track value delivered in each iteration (sprint or cycle).
- Feedback Loops:
- Gather feedback from stakeholders, users, and team members.
- Adapt based on insights to enhance value delivery.
Value-driven performance requires a collaborative mindset, adaptability, and a focus on delivering meaningful outcomes.
The financial investments come when the company has the capacity to create a competitive advantage and keep it for a long time through innovations.
SUMMARIZING WHERE IS THE VALUE
This value breakdown from the “Economic perspective” until the “Delivery approach” discussed in the previous sections helps us figure out the answer to the “Where is the value?”. I suppose.
Profitability is the company game to play. It’s all about having funds to invest in new products/services to keep the profitability and the wheel running.
The business value indicates the relationship transitions between past, present, and future economic company situations to remain attractive. All that makes the gears run, I mean, is what makes the team keep walking forward to reach out to the next value for new generations that are growing up in the market space.
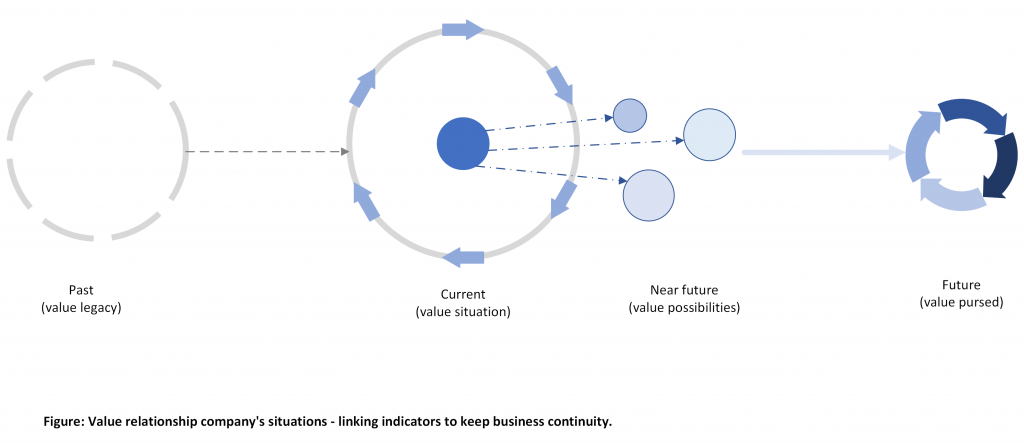
In other words, business value measures how past, present, and future can keep the company’s situation valuable. The company valuation depends on it.
Basically, “what market are you in, and what is your capacity to grow in it?”
The company valuation (Market Cap) at the bottom line is all about the impact of the value-delivery over time. And, for sure, there must be a high trend in the shares’ equity.
No responses yet