
By Zózimo De Souza Jr.
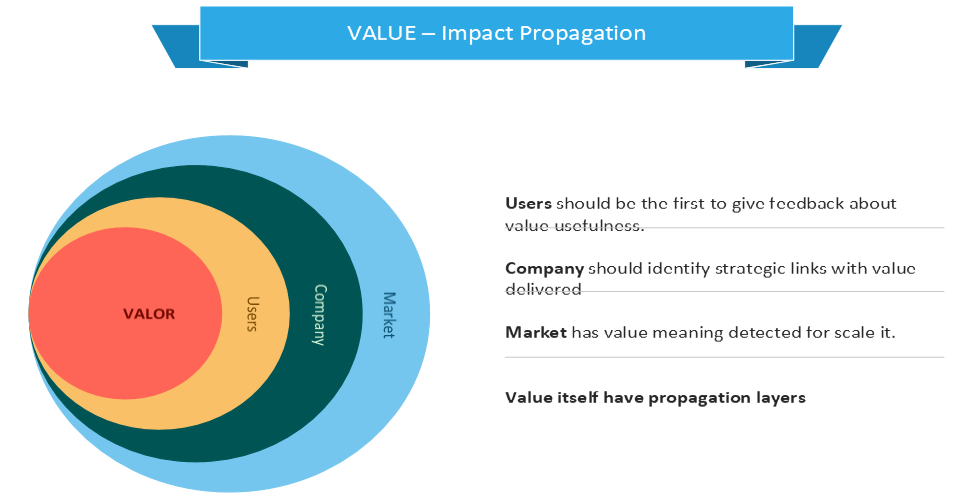
The impact of value propagation needs to be analyzed before determining the real meaning of value for the Client (users) and the Company (business pursuing).
Value concerns interdependence and dependency relation indicators from user utility and company valuation. At the bottom line, market perception about both indicators impacts analysis.
Some key principles of value management (VM) are:
- An unending quest for enhancing value for the organization: This involves establishing metrics or estimates of value and continuously monitoring and controlling them.
- A focus on a clear definition of objectives and identification of targets before seeking solutions: This principle emphasizes the importance of understanding what needs to be achieved before looking for ways to achieve it.
- A focus on function: This is pivotal to maximizing outcomes that are innovative, meaningful, and practical. It involves understanding the essential functions that need to be performed and finding the best ways to achieve them.
We just can’t determine the meaning of the value using a fixed formulation. Value comes from observed perspectives. This requires establishing a standpoint for value propagation analysis.
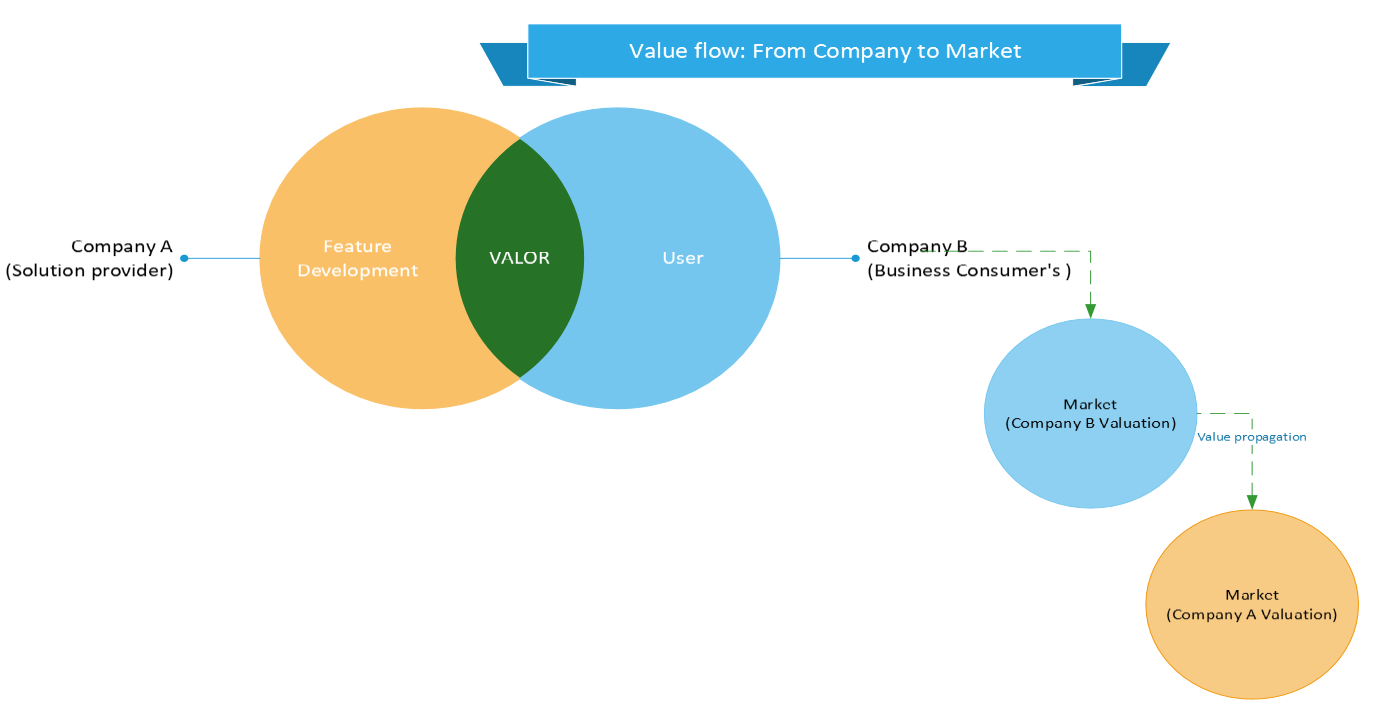
Value propagation analyses unfold the relation between the value, users, enterprise (both sides – suppliers and comsumers), and market fields.
Value propagation analyses elucidate the intricate relationships between value, users, enterprises (both suppliers and consumers), and market fields. To provide a more detailed overview, it is essential to consider the following indicators that link these elements:
- User Satisfaction and Experience: Metrics such as Net Promoter Score (NPS), Customer Satisfaction (CSAT), and Customer Effort Score (CES) can help gauge how well the value delivered meets user expectations and enhances their experience.
- Enterprise Performance: Key Performance Indicators (KPIs) like Return on Investment (ROI), profit margins, and market share can illustrate how effectively enterprises are creating and capturing value.
- Supplier Efficiency: Indicators such as lead time, quality of materials, and cost of procurement can provide insights into how well suppliers are contributing to the overall value chain.
- Market Dynamics: Market indicators like demand trends, competitive positioning, and price elasticity can help understand how value is perceived and propagated in the market.
- Innovation and Development: Metrics such as the rate of new product development, adoption of new technologies, and R&D expenditure can show how innovation drives value creation.
- Sustainability and Social Impact: Indicators like carbon footprint, social responsibility scores, and compliance with environmental regulations can reflect the broader impact of value creation on society and the environment.
By analyzing these indicators, enterprises can gain a comprehensive understanding of how value is propagated across different stakeholders and market fields, enabling them to make informed decisions to enhance overall value creation and capture.
INTERDEPENDENCE VS. DEPENDENCE INDICATORS
Interdependence and dependence indicators describe different types of relationships between entities within a value chain or ecosystem. A detailed differentiation between the two, along with examples of indicators for each is described below.
Interdependence Indicators
Interdependence refers to a mutual reliance between entities, where each party benefits from and contributes to the relationship. This type of relationship is characterized by collaboration, shared goals, and mutual benefits.
Indicators of Interdependence:
- Collaboration Metrics:
- Joint Ventures and Partnerships: Number and success rate of joint ventures or strategic partnerships.
- Co-development Projects: Number of co-developed products or services.
- Shared Value Creation:
- Revenue Sharing: Proportion of revenue generated from collaborative efforts.
- Innovation Metrics: Number of patents filed jointly, or shared R&D investments.
- Supply Chain Integration:
- Information Sharing: Frequency and quality of data exchanged between partners.
- Supply Chain Synchronization: Metrics on synchronized production schedules and inventory levels.
- Customer-Supplier Relationships:
- Supplier Performance: Metrics on supplier reliability, quality, and responsiveness.
- Customer Feedback: Joint customer satisfaction scores and feedback mechanisms.
Dependence Indicators
Dependence refers to a one-sided reliance where one entity relies significantly on another for resources, support, or outcomes. This type of relationship can create vulnerabilities if the dependent party lacks alternatives.
Indicators of Dependence:
- Supplier Dependence:
- Supplier Concentration: Percentage of total procurement from a single supplier.
- Switching Costs: Costs associated with changing suppliers.
- Customer Dependence:
- Customer Concentration: Percentage of revenue generated from a single customer or a small group of customers.
- Customer Retention Rates: Metrics on the ability to retain key customers.
- Resource Dependence:
- Critical Resource Availability: Dependence on specific raw materials or technologies.
- Alternative Sources: Number and viability of alternative sources for critical resources.
- Market Dependence:
- Market Share: Proportion of business reliant on a specific market or region.
- Regulatory Environment: Dependence on favorable regulatory conditions in a particular market.
Examples:
- Interdependence Example: A technology company and a hardware manufacturer collaborate to develop a new product. They share R&D costs, jointly market the product, and split the revenue. Indicators here would include the number of co-developed products, shared revenue, and joint customer satisfaction scores.
- Dependence Example: A small supplier relies on a large retailer for 80% of its sales. Indicators would include the percentage of revenue from the retailer, the cost of finding new customers, and the supplier’s ability to diversify its customer base.
By understanding and measuring these indicators, organizations can better manage their relationships, mitigate risks associated with dependence, and leverage the benefits of interdependence.
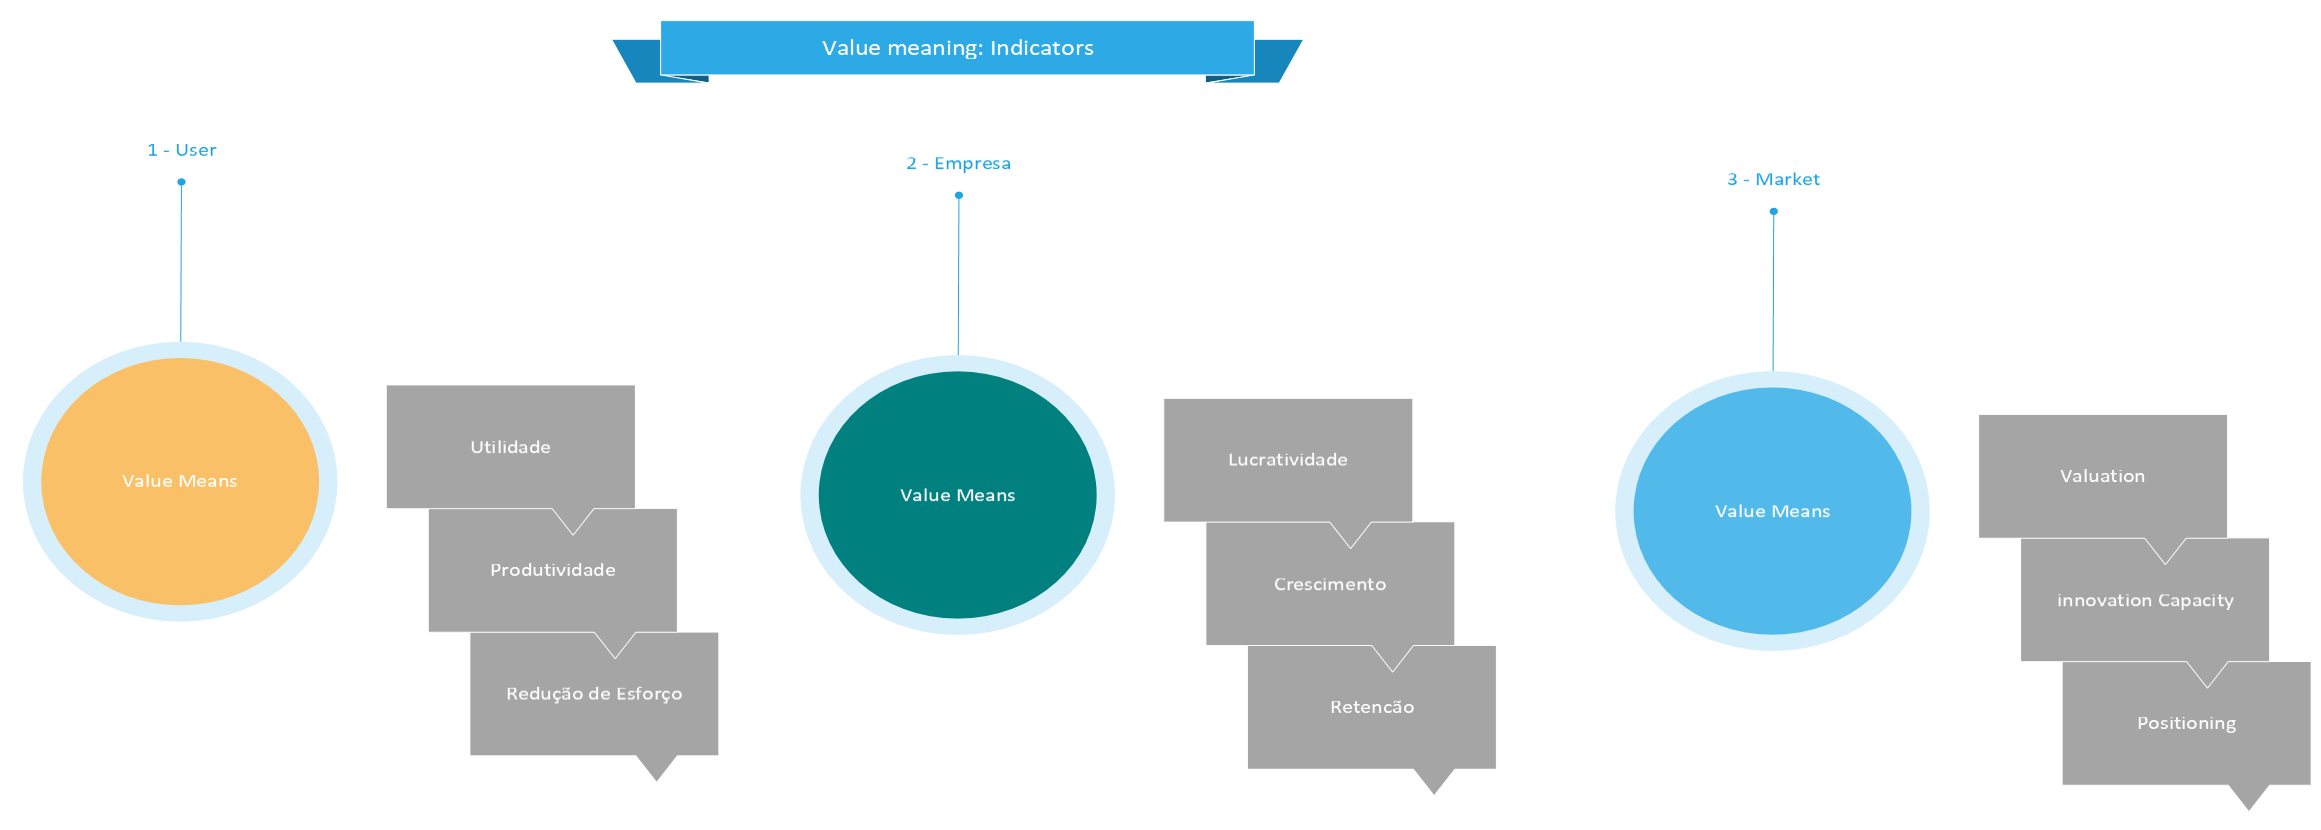
Users and the Company have different perspectives on value meaning and the impact of its success.
The importance of evidence it (Users and Company) analysing indicators to the value utility for users and the impact of value delivery for company valuation.
Understanding the different perspectives on value between users and the company is crucial for aligning strategies and ensuring mutual success. Herein how to evidence and consider the value utility for users and the impact of value delivery for company valuation:
Value Utility for Users
Value utility for users refers to the perceived benefits and satisfaction they derive from a product or service. This can be evidenced through various metrics and feedback mechanisms:
- Customer Satisfaction and Experience:
- Net Promoter Score (NPS): Measures user willingness to recommend the product or service to others.
- Customer Satisfaction (CSAT): Direct feedback on user satisfaction with specific aspects of the product or service.
- Customer Effort Score (CES): Assesses how easy it is for users to interact with the company and use its products.
- Usage Metrics:
- Adoption Rates: The rate at which new users start using the product or service.
- Engagement Metrics: Frequency and duration of product or service use.
- Retention Rates: The percentage of users who continue to use the product or service over time.
- Qualitative Feedback:
- User Reviews and Testimonials: Direct feedback from users about their experiences.
- Focus Groups and Interviews: In-depth discussions to understand user needs and perceptions.
- Performance and Reliability:
- Uptime and Downtime: Metrics on the availability and reliability of the product or service.
- Response Times: How quickly the product or service performs tasks or how quickly customer support responds to inquiries.
Impact of Value Delivery on Company Valuation
The impact of value delivery on company valuation can be evidenced through financial and strategic metrics that reflect the company’s performance and market position:
- Revenue and Profitability:
- Revenue Growth: Increase in sales as a result of delivering value to users.
- Profit Margins: The profitability of products or services, indicating efficient value delivery.
- Market Share and Competitive Position:
- Market Share: The company’s share of the market relative to competitors.
- Competitive Advantage: Unique value propositions that differentiate the company from competitors.
- Customer Lifetime Value (CLV):
- CLV: The total revenue expected from a customer over the duration of their relationship with the company.
- Customer Acquisition Cost (CAC): The cost of acquiring new customers, which should be lower than the CLV for sustainable growth.
- Brand Equity and Reputation:
- Brand Strength: Metrics such as brand awareness, brand loyalty, and overall brand perception.
- Reputation Scores: Ratings from industry analysts, customer reviews, and media coverage.
- Operational Efficiency:
- Cost of Goods Sold (COGS): The direct costs attributable to the production of the goods sold by the company.
- Operational Metrics: Efficiency in production, supply chain management, and service delivery.
- Innovation and Growth Potential:
- R&D Investment: Expenditure on research and development to create new value.
- Product Pipeline: The number and potential impact of new products or services in development.
Bridging the Perspectives
To bridge the perspectives of users and the company, it’s essential to align user value utility with company value delivery:
- User-Centric Design: Incorporate user feedback into product development to ensure the product meets user needs and expectations.
- Value Proposition Communication: Clearly communicate the benefits and value of the product to users.
- Continuous Improvement: Use user feedback and performance metrics to continuously improve the product or service.
- Alignment of Goals: Ensure that company goals (e.g., revenue growth, market share) are aligned with delivering value to users.
By systematically measuring and analyzing these indicators, companies can ensure that they are delivering value that meets user needs while also enhancing their own valuation and market position.
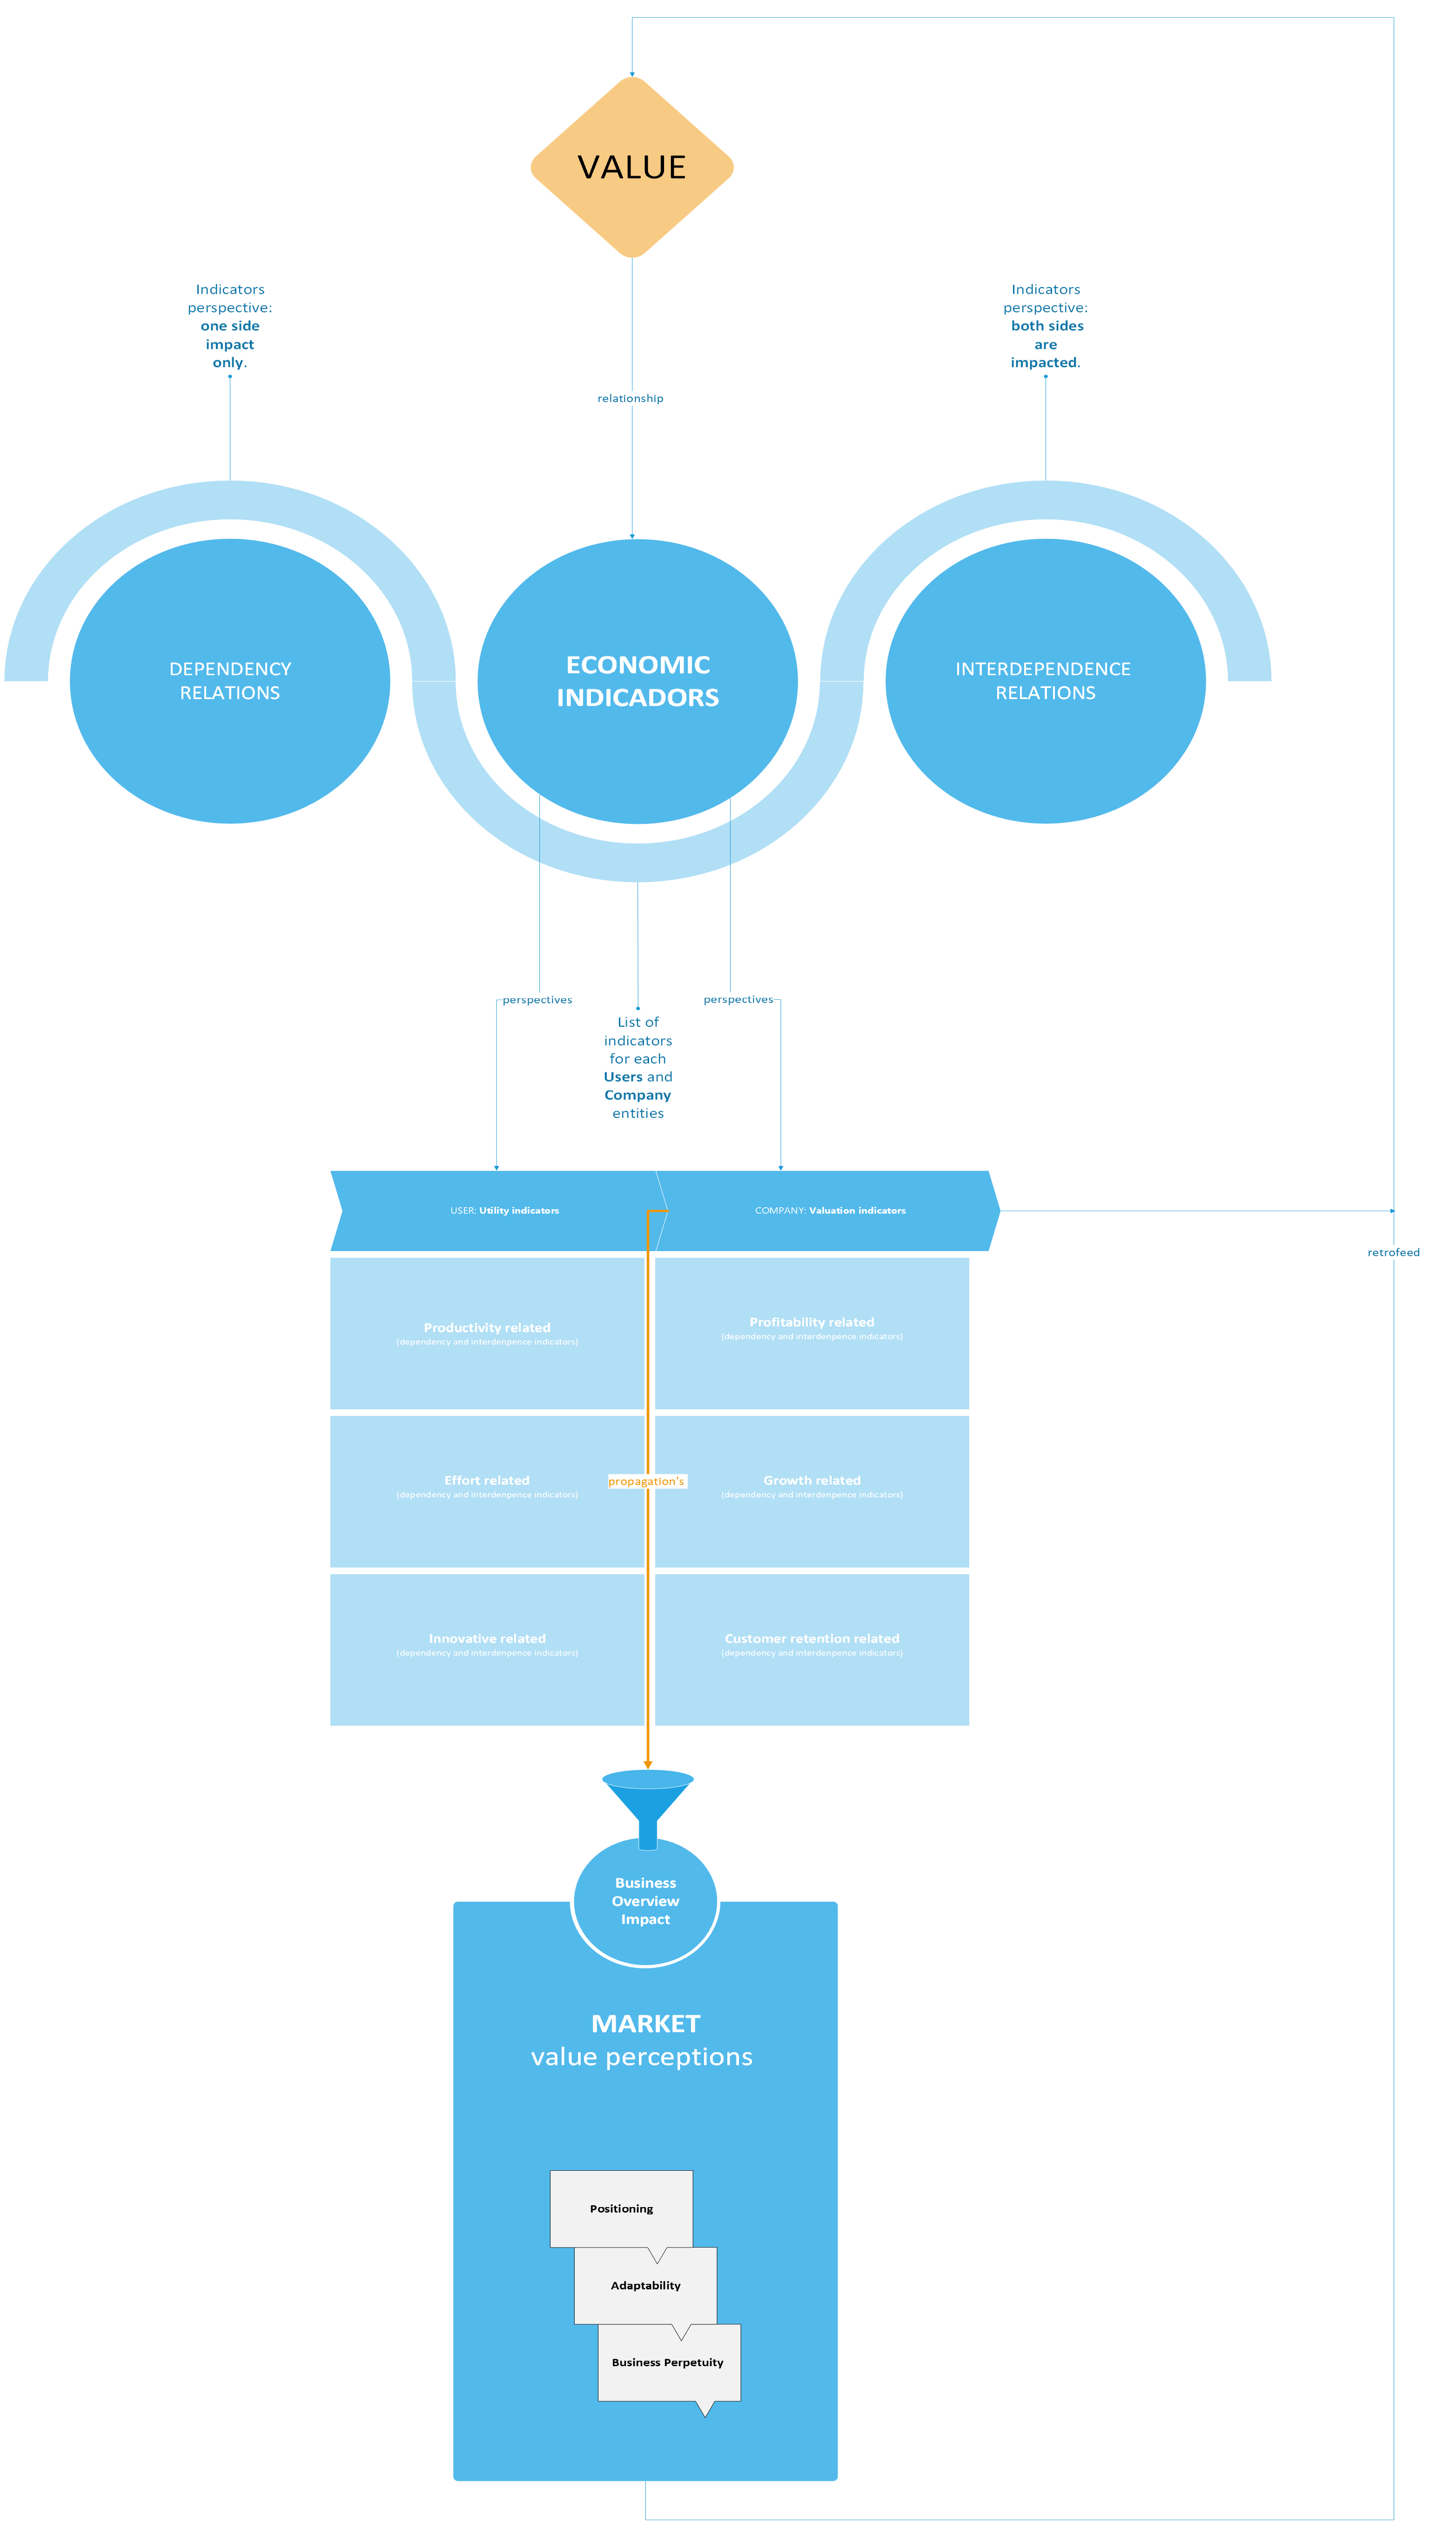
Here is the framework for value propagation analysis summarized:
Conclusion
Understanding and aligning the perspectives of value between users and the company is essential for mutual success. Value utility for users can be evidenced through metrics such as customer satisfaction, usage rates, and qualitative feedback, which highlight the benefits and satisfaction derived from a product or service. On the other hand, the impact of value delivery on company valuation can be measured through financial performance, market share, customer lifetime value, brand equity, operational efficiency, and innovation potential.
By bridging these perspectives through user-centric design, clear communication of value propositions, continuous improvement, and goal alignment, companies can ensure they deliver meaningful value to users while enhancing their own market position and financial performance. This holistic approach not only fosters user satisfaction and loyalty but also drives sustainable growth and competitive advantage for the company.
No responses yet